Southern Oregon Coast
Capital Flows in Oregon’s Southern Coast
This section explores capital trends in Coos, Curry, and Douglas Counties–an area covered by the CCD Business Development Corporation, an Oregon Economic Development District, and agreed upon as an insightful geographic focus by the Steering Committee. The intent of this section is to use a geographic lens, rather than an industry lens, to understand more about capital availability in a select part of the state.
The Southern Oregon Coast economy is smaller and slower-growing than the state overall, reflecting both demographic headwinds and limited access to scalable capital. This area sits at the intersection of marine, forest, and tourism economies and is anchored by communities such as Coos Bay, North Bend, Bandon, Brookings, and Roseberg. It is geographically remote relative to the I-5 corridor and Portland metro, but its ports, natural resources, and quality of life shape its economic identity.
Historically, timber harvest, sawmills, and seafood processing dominated the region’s economy. Shifts in federal land management and global competition led to mill closures and employment loss in wood products beginning in the late 20th century (see Forestry and Wood Products). Today, the Southern Oregon Coast economy is a mix of healthcare, government, education, tourism, and resource-based industries (forestry, fishing, food processing). Seasonal fluctuations are common, tied to tourism peaks, agricultural harvests, and weather trends.
The Southern Oregon Coast has experienced slow or negative population growth relative to the state overall. Many young residents leave for education and job opportunities, while the region continues to attract older retirees. Employment growth has lagged the state average, and job recovery from the pandemic has been uneven, with health care and hospitality appearing to rebound faster than manufacturing or resource-based industries, though hospitals in rural areas face considerable challenges to maintain funding and staffing. Take for example the Bay Area Hospital, the largest employer on the Southern Oregon Coast with 1,100 staff, which has operated at an average annual loss of $24 million over the last 3 years and is in default on a $45 million loan that threatens the future of the facility.1
Organizations like CCD Business Development Corporation, the South Coast Development Council (SCDC), and the Southwestern SBDC (Small Business Development Center) are critical intermediaries for local business finance. The stakeholder interview with CCD discussion highlighted the organizations above and beyond work to support small businesses, particularly during the difficult COVID lockdown. This work led CCD’s executive director, Theresa Haga, to be named as OEDA’s 2024 Economic Development Leader of the Year. In fiscal year 2023-2024, CCD approved or funded 13 in-house Revolving Loans and 3 SBA 504 Loan projects, totaling over $8.7 million in direct funds to local small businesses. Nevertheless, all three organizations described facing chronic capacity constraints. Limited staff, grant-writing bandwidth, and technical-assistance resources restrict both their ability to attract capital and small businesses’ ability to access it.
Stakeholders also cited low financial literacy among entrepreneurs, many of whom grew reliant on pandemic-era relief programs. As those one-time grants have disappeared, businesses have struggled to adjust to traditional lending and cash-flow conditions. Debt capital is present through regional banks and credit unions, and CDFIs and SBA programs provide some capital flexibility. But equity capital and growth-stage finance are nearly absent.
Takeaway
Stakeholders describe availability of debt capital but limited local wealth, collateral, and capacity to pursue larger-scale financing.
Regional Economic and Demographic Context
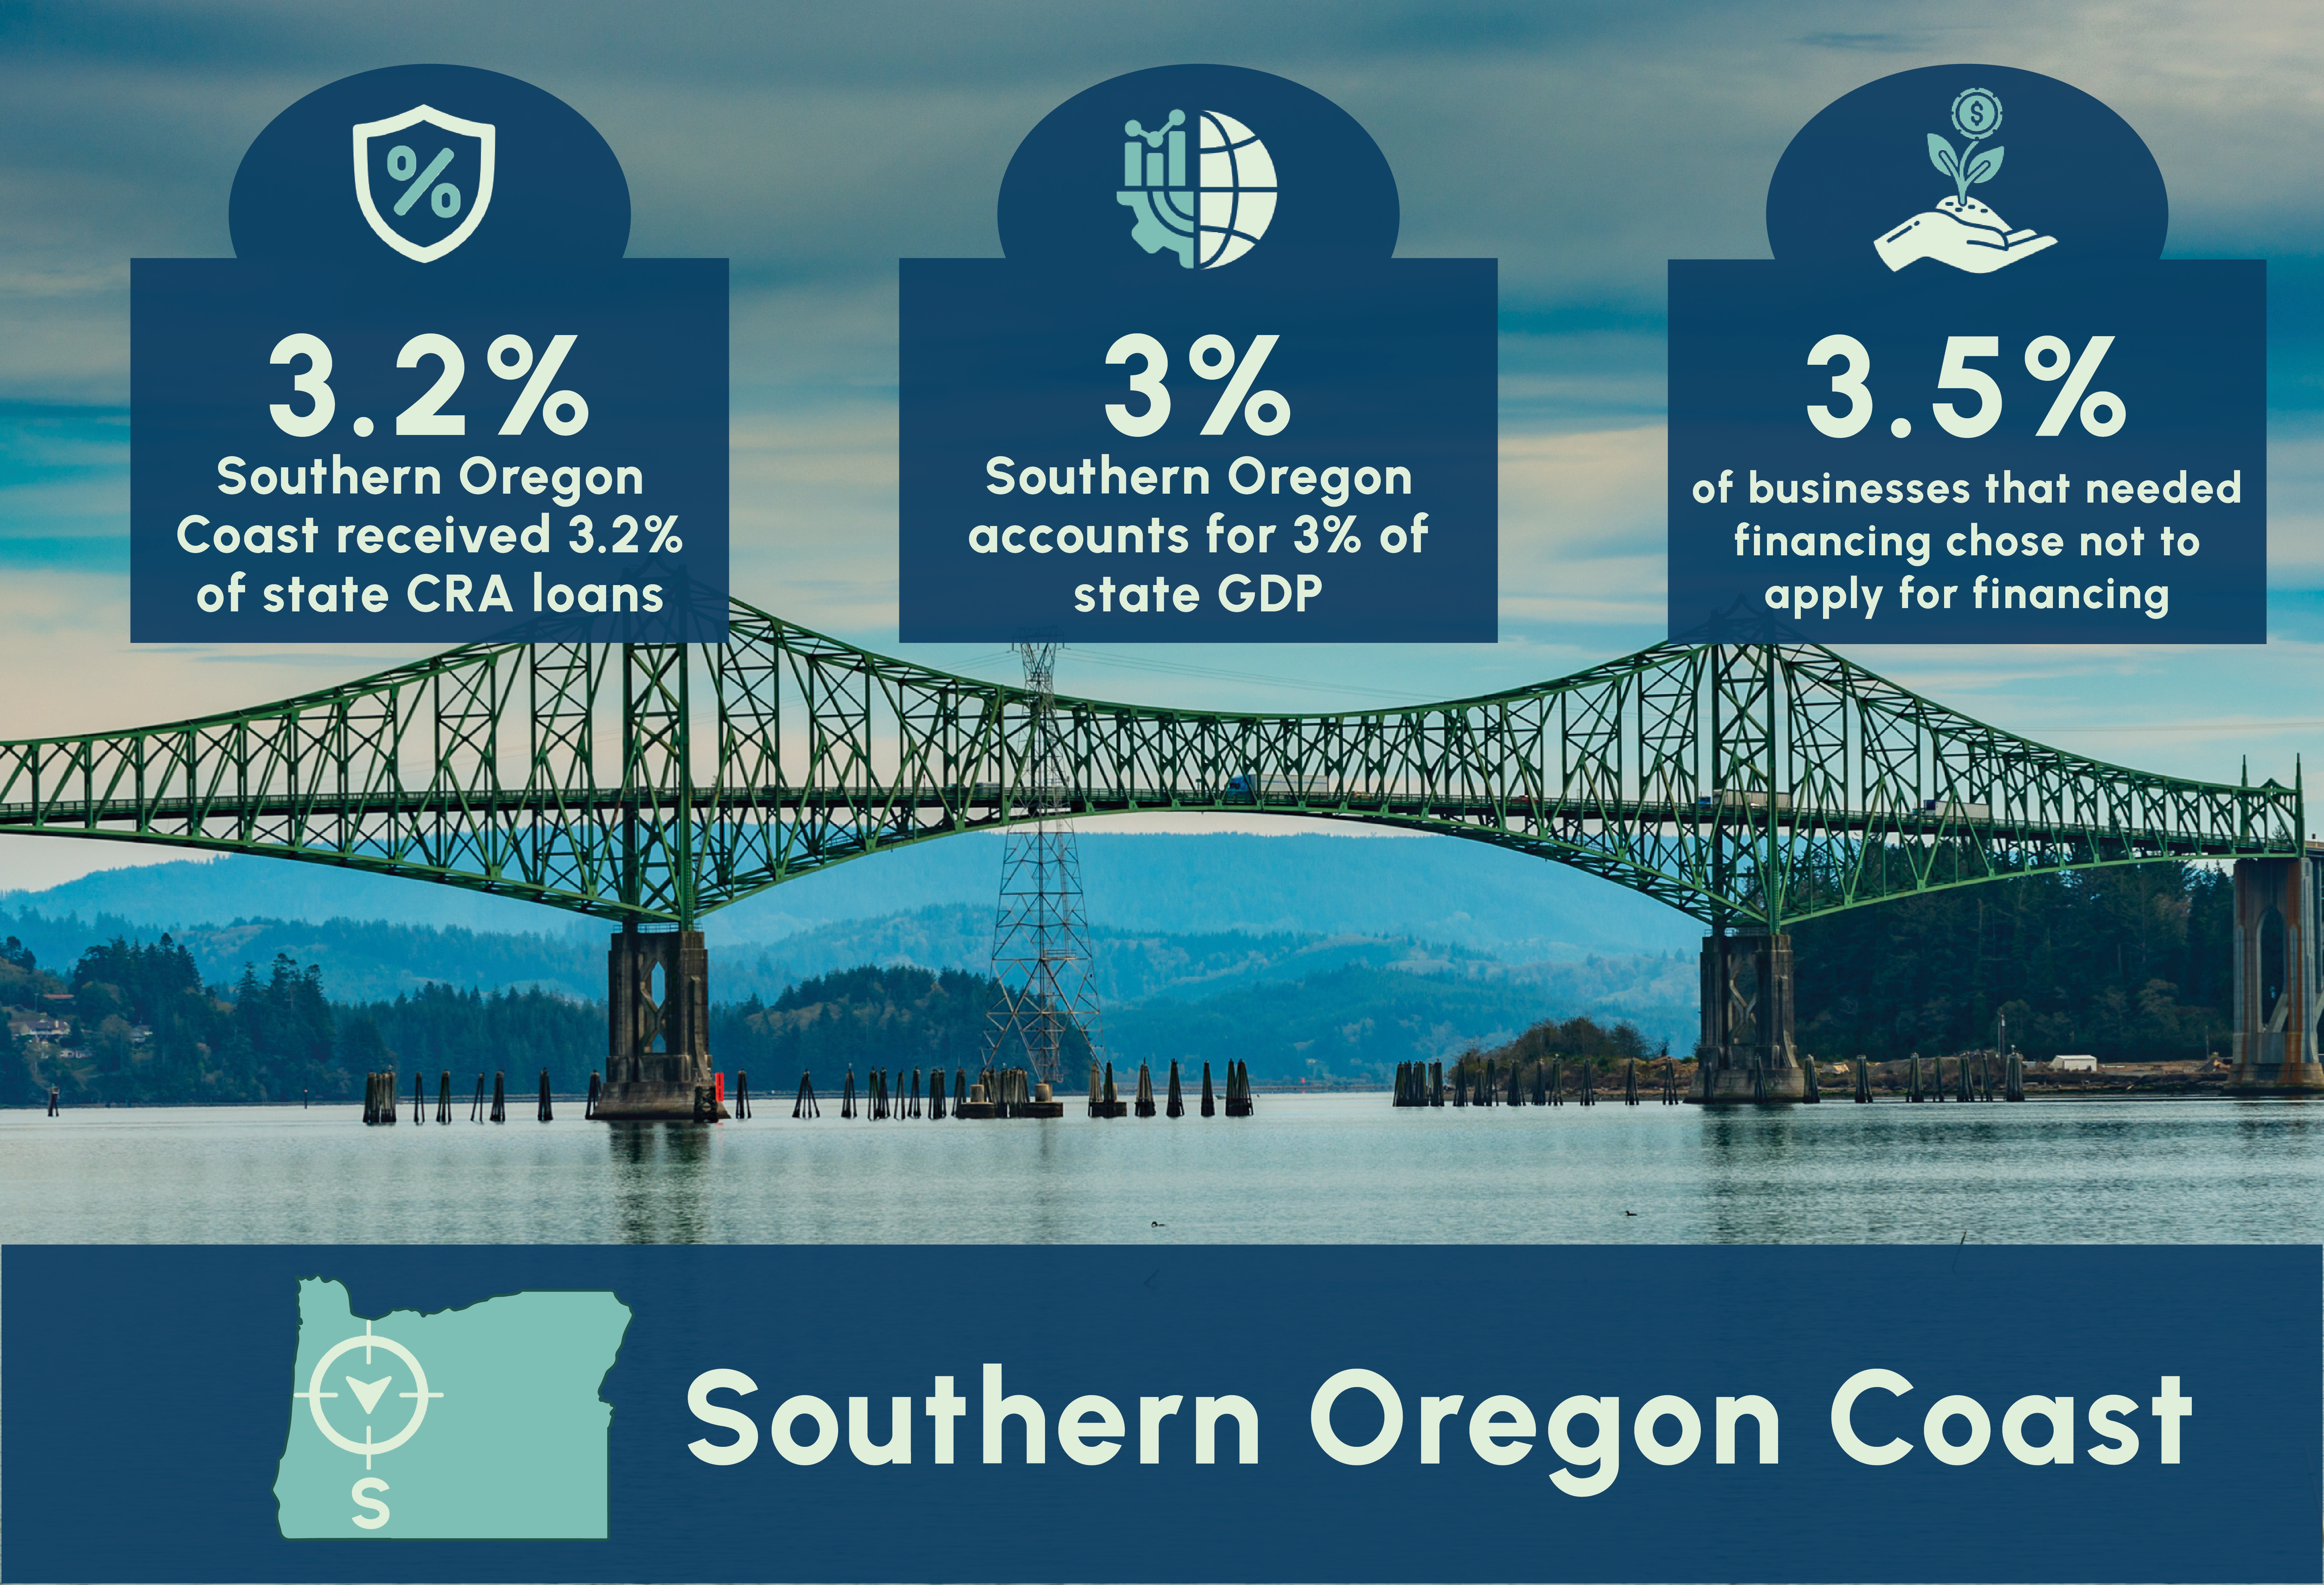
Today, the Southern Oregon Coast region’s economy is undersized relative to its population. As of 2023, the region accounted for 4.7% of the state’s population, but only 3.4% of its employment and 3% of the state’s GDP. Over the last decade, GDP growth in the region has lagged statewide GDP growth. While this was especially pronounced before the COVID-19 pandemic, the region has closed the gap only slightly since then.
The Southern Oregon Coast region has an aging population and is projected to experience population loss in the coming decades. Over the last 20 years, the region’s population growth has relied on domestic in-migration, meaning it has not grown through births outpacing deaths, and net domestic migration shows significant decline since 2021. As the region’s population continues to age and contract, the residents’ needs and, as a result, the structure of the local economy, are likely to also shift significantly in the years ahead.
On the Southern Oregon Coast, government spending is a significant driver of the region’s GDP, roughly equivalent to the GDP contribution of the largest regional industry of Finance, Insurance and Real Estate.2 Establishments in the Healthcare and Social Assistance industry are the largest employers accounting for 20% of the region’s jobs. This concentration of Healthcare and Social Assistance employers is not abnormal for a predominantly rural and older community, but is a major driver of the local economy, and under threat as the Bay Area Hospital, the largest regional hospital, faces default on its primary loan and faces challenges retaining and attracting medical staff.
Takeaway
The Healthcare and Social Assistance industry accounts for 20% of the region’s jobs.
Source: Bureau of Economic Analysis (BEA) (2013-2023)
The region has seen an increased rate of business formation since the COVID-19 pandemic. Capital availability–especially capital for early and mid-start business expansions–become especially important in this context. This increase in business formation merits additional investigation to understand how access to capital may have supported this growth.
Takeaway
Business formations on the Southern Oregon Coast have grown since 2020.
Source: U.S. Census Bureau (2005-2024)
What Industries Have a High Concentration In the Region?
Several industries in the Southern Oregon Coast region have high employment concentration relative to population and general GDP contribution. Over 10% of the state’s mining, quarrying and oil extraction GDP come from this region. The region also accounts for 6.6% of the state’s Agriculture, Forestry and Fishing industry GDP. Manufacturing and Accommodation and Food Services are two other industries with fairly high concentrations in the region, accounting for about 3.8% of the state’s industry GDP each.
Source: Bureau of Economic Analysis (BEA) (2013-2023)
What Industries Are Growing In the Region?
The Manufacturing industry has almost doubled in size in the Southern Oregon Coast region since 2019, growing into a $1.36 billion dollar industry. The Trade industry and Healthcare and Social Assistance industry have seen moderate growth in the past decade and are now the fourth and fifth largest industries in terms of the region’s GDP share.
Role of Capital
Capital flows in the region are generally in line with what we would expect to see of a region with the economic and demographic characteristics described above.
Local capital providers include regional banks and credit unions such as Columbia Bank (formerly Umpqua bank), Banner Bank, Oregon Pacific Bank, and Rogue Credit Union. These institutions primarily provide traditional debt financing for small businesses. Local economic development stakeholders described how local loan underwriting tends to lean conservative (more risk-averse), requiring strong collateral and predictable revenue, which many local borrowers cannot provide.
Outside capital providers
Some Business Oregon programs provide loan guarantees, venture development funding, and grants. Stakeholders discussed how awareness and accessibility among entrepreneurs is lacking to adequately access these funds. CDFIs such as Craft3 and Community LendingWorks have a history of lending in the region, although stakeholders described a desire for more CDFI activity in the region.
There are 5 CDFI institutions on the Southern Oregon Coast that provided business loans in fiscal year 2022. Each CDFI provided one loan, and the loans ranged from $6,000 up to $1.5 million, accounting for a total of $2.1 million dollars in loans and lines of credit. One CDFI loan was guaranteed by the SBA. The Southern Oregon Coast CDFI activity accounted for 1.1% of total CDFI business credit disbursements in the state. This level of activity on the Southern Oregon Coast is proportionally less than the region’s share of population (4.7%), employment (3.4%), and GDP (3%).
Debt capital supply overall in the South Oregon Coast appears fairly healthy across a number of metrics.
Starting with SBA 7a loans, the region has consistently seen about 20 SBA loans disbursed every year for the last decade. Since 2020, the region has received about $93.6 million or 4.1% of statewide SBA loan dispersals. While the frequency of SBA 504 loans is more erratic, the region has received $12.6 million, 3% of total SBA 504 dollars provided in the state since 2020. In terms of the capital inflow, this is roughly inline, or even slightly outsized compared to the region’s GDP and employment.
Source: U.S. Small Business Administration (SBA) (2010-2025 YTD)
Source: U.S. Small Business Administration (SBA) (2010-2025 YTD)
Similar trends are seen in the Community Reinvestment Act Loan (CRA) disbursements. The Community Reinvestment Act requires the Federal Reserve and other federal banking regulators to encourage financial institutions to help meet the credit needs of the communities in which they do business, including low- and moderate-income (LMI) neighborhoods. Low-income neighborhoods are defined by the U.S. Census Bureau as communities with a median family income of less than 50% of the area median income. A moderate-income community means that the median family income is at least 50% and less than 80% of the area median income. These loans represent a significant share of small business loans, accounting for 77% of small business loans nationally.3
Since 2016, the region has received around 3,000 CRA loans each year, with a spike (especially in terms of dollars of debt) in 2020. The majority of these loans are under $100,000. In 2023, this accounted for $70 million of debt provided in the region or 3.2% of total CRA loans provided in the state. Columbia Bank and Banner Bank were the largest providers in 2023, providing $19.2 million and $12.1 million respectively. Large banks like American Express National Bank, US Bank, and JP Morgan Chase gave out more loans, however these were smaller in size and thus resulted in smaller total capital injections. In total, 38 banks actively provided CRA loans in the region in 2023.
Source: Federal Financial Institutions Examination Council (FFIEC) (2016-2023)
Source: Federal Financial Institutions Examination Council (FFIEC) (2016-2023)
The Southern Oregon Coast debt activity has been roughly in line with its share of state economic output, but it is harder to ascertain the industries to which this debt may be flowing to. Additionally, there is no publicly available data set to analyze traditional banking debt offered to businesses that fall outside the CRA umbrella.
The analysis next turns to Pitchbook data to understand equity activity in the region. While there are some equity deals, the total number of deals in the region are modest. Pitchbook shows a small amount of mergers and acquisitions happening each year for companies headquartered in the region (an average of 2 per year since 2020). Over the past four years, just under 50% of these companies have been acquired by other Oregon-based companies. In recent years, there have also been a handful of Seed investments in the region. Of the four early stage deals observed since 2023, one was an acquisition of an inn, one was an equity investment in an environmental infrastructure manufacturing company, and the final two were related to food and beverage production and sales.
Source: PitchBook Data (2015-2025 YTD)
Source: PitchBook Data (2015-2025 YTD)
Pitchbook data also suggest a steady volume of grant deals in the region. On further inquiry, most of these deals are not to private companies, but rather federal grants to regional service providers like Housing Authorities and Health Centers. Up through 2022, the same regional service providers were regularly receiving a variety of grants annually, but there are no recorded grant deals at this stage since then. This presence of grant capital is somewhat expected given the high concentration of healthcare, social assistance and government establishments in the region. These establishments are often reliant on grant dollars to provide services to their population and likely mostly supporting existing services as opposed to amplifying economic growth.
Takeaway
Most recorded grant activity supports service organizations, such as housing authorities and health centers, rather than private firms.
Annual Business Survey
The Annual Business Survey indicates that businesses on the Southern Oregon Coast were generally less likely to report a need for additional financing compared to the statewide average. Among the 4,075 respondents in this region, most said they did not need financing. Those who reported seeking capital on the Southern Oregon Coast had similar success in securing the amounts requested as compared to the state, and the Southern Oregon Coast had a lower share of respondents who reported needing additional financing but chose not to apply. On paper, this suggests that access to lending on the South Coast is relatively strong.
However, stakeholder interviews paint a more complicated picture. Local business owners and lenders described challenges that statistics alone do not capture, including limited banking presence in smaller communities, more conservative underwriting standards, and collateral requirements that are difficult for small or rural firms to meet. Together, these dynamics make borrowing feel more constrained than the survey results suggest.
Source: U.S. Census Bureau (2022)
Case Study: 7 Devils Brewery
![]()
Founded in 2013, 7 Devils Brewing has become a cultural anchor in Coos Bay, known not only for its craft beer, but also for its role as a community gathering space. The brewery began with a downtown pub that gained a reputation for live music, local art, and a welcoming atmosphere. Over the years, it has grown and expanded into a second location on the Coos Bay waterfront, solidifying its place as both a business and a community institution on the Southern Oregon Coast employing upwards of 80 people.
What Was the Capital Story That Propelled Their Growth?
7 Devils Brewing’s capital story is one of community trust and access to non-traditional financing. Founders Carmen and Annie Matthews knew there was strong local demand for a brewpub, having lived in Coos Bay for decades, but they lacked the business plan and personal collateral required for a traditional startup loan. Instead, they turned to family and community support. An initial $150,000 family loan provided equipment, but fell short of startup needs. That loan eventually grew to about $700,000, supplemented by community contributions for finishes and artwork, and secured by a “sweetheart” lease arrangement that made 7 Devils Brewing the anchor tenant in a building tied to a local investor’s plans for a recording studio. This blend of personal networks and community goodwill proved crucial since at the same time three other brewery efforts in Coos Bay failed to get off the ground.
From the outset, all profits were reinvested back into the business, delaying any owner distributions. By 2019, however, 7 Devils Brewing saw expansion as essential for survival. As the only brewery in Coos Bay, they feared that if a larger competitor entered the market, profitability could collapse. Just before the pandemic, they signed a lease for a waterfront location, timing that left them with an additional mortgage and no income as shutdowns began.
Financing the waterfront expansion relied again on self-financing and family loans: about $250,000 in founder capital, followed by roughly $1 million in additional family-backed loans. Public programs offered limited relief. They received employer retention tax credits and PPP funds, but the PPP loans could not be applied to the new location because it was classified as a new startup. Furthermore, the company’s limited financial record made it ineligible for significant bank support, and its sole credit card with a $5,000 daily limit illustrated how little credit was available.
Despite these hurdles, the waterfront location was profitable from its first day of operation, though it has drawn business away from the original pub, which now hovers near break-even. Today, the two locations together employ upwards of 80 people and serve as community “third spaces.” The founders’ deep civic engagement—leading music festivals, teaching at the local Southwestern Oregon Community College, and serving on city council—has helped cement goodwill and local buy-in, ensuring that 7 Devils remains both an economic success and a cultural hub for the South Coast.

References
Bay Area Hospital. 2025. “Bay Area Hospital in Oregon: Coos Bay Medical Center.” August 20. https://bayareahospital.org/wp-content/uploads/2025/09/BAH-Fact-Sheet-Sept-2025-final-2.pdf.
Bureau of Economic Analysis (BEA). 2013-2023. “Gross Domestic Product (GDP) by County.” 2013-2023. https://www.bea.gov/data/gdp/gdp-county-metro-and-other-areas.
Federal Financial Institutions Examination Council (FFIEC). 2016-2023. “Community Reinvestment Act (CRA) Disclosure Data.” 2016-2023. https://www.ffiec.gov/data/cra/flat-files.
Federal Financial Institutions Examination Council (FFIEC). 2025. “Findings from Analysis of Nationwide Summary Statistics for 2023 Community Reinvestment Act Data Fact Sheet.” November 12. https://www.ffiec.gov/data/cra/findings-from-2023-data-fact-sheet.
PitchBook Data, Inc. 2015-2025 YTD. “PitchBook Private Capital Markets Database.” 2015-2025 YTD. https://pitchbook.com. Accessed October 8, 2025.
U.S. Bureau of Labor Statistics (BLS). 2024. “Quarterly Census of Employment and Wages (QCEW).” https://www.bls.gov/cew/.
U.S. Census Bureau. 2005-2024. “Business Formation Statistics (BFS).” 2005-2024. https://www.census.gov/econ_datasets/.
U.S. Census Bureau. 2022. “Annual Business Survey (ABS).” https://www.census.gov/programs-surveys/abs.html.
U.S. Census Bureau. 2024. “American Community Survey (ACS) 1-Year Estimates.” https://www.census.gov/programs-surveys/acs/.
U.S. Small Business Administration (SBA). 2010-2025 YTD. “Small Business Administration (SBA) 7(a) Loan Program.” 2010-2025 YTD. https://data.sba.gov/dataset/7-a-504-foia.