
Food and Beverage Manufacturing
Capital Flows in Oregon’s Food and Beverage Manufacturing industry
The Oregon Capital Scan serves as both a research platform and an educational tool and is a shared foundation for collective action to make Oregon’s capital ecosystem more transparent, inclusive, and effective in supporting business growth. This year’s Oregon Capital Scan differs from previous scans in three important ways.
First, it is the first year that ECOnorthwest has been contracted for the research. This shift has prompted a careful review of which data are available, relevant, and reliable, and how limitations should be communicated so readers can interpret results with confidence.
Second, instead of attempting to review all the possible capital data available everywhere, the focus is on specific industry clusters that Business Oregon identifies as target industries that “provide Oregon the best opportunities for growth, innovation, high wages, competitiveness, and statewide prosperity.” The target industry clusters agreed upon by the Steering Committee to research include high tech, forestry and wood products, and food and beverage. A cluster lens lets us connect capital patterns to industry structure, firm mix, and real financing needs, and it aligns with statewide priorities.
Third, the analysis includes a geographic deep-dive on the Southern Oregon Coast Economic Development District. A focused regional lens brings light to the local capital dynamics that statewide averages tend to mask. Rural Oregon is not monolithic, and a single scan cannot meaningfully cover every rural community. Attempting to cover them all would be too broad to yield actionable findings. By concentrating on the Southern Oregon Coast, the analysis is able to explore one region in depth, highlighting dynamics that may resonate with other rural areas, while still producing insights that are targeted and useful for the communities, businesses, and policymakers in that part of the state.
Capital in this report refers to the financial resources that enable businesses to start, grow, and adapt. Businesses rely on many forms of capital, from personal savings and community investment to bank loans, venture funds, and federal grants. Each type of capital carries different expectations for risk, return, and repayment, shaping how and where businesses can grow.
Capital is one of many critical factors that influence business growth. The Oregon Capital Scan focuses on where capital is flowing and where observable gaps remain that limit growth potential for each industry cluster (High Tech, Forest & Wood Products, and Food & Beverage) as well as for the Southern Oregon Coast. The report also includes an Oregon overall section where several of the key data sources can be viewed at a broader statewide level. A description of the types of capital explored in this report follows below.
This Oregon Capital Scan focuses on three categories of capital: debt, equity, and grants. Each serves a distinct purpose in the financial ecosystem and carries its own balance of risk, return, and control. These capital types are mapped onto a capital ladder to show relevance at the various stages of business development and are further defined below.
Debt capital provides funding that must be repaid over time, usually with terms and interest. It includes commercial and credit union loans, SBA-backed programs, and other lending mechanisms that allow businesses to expand while retaining full ownership. For established companies with predictable revenues, debt can be an efficient and relatively low-cost way to finance operations or investment. For younger firms, however, the fixed repayment obligations can pose significant risk if cash flows are uncertain.
Equity capital represents money invested in exchange for an ownership stake in the company. This includes friends-and-family investors, angel networks, venture capital firms, and, at later stages, private equity investors. Equity financing fuels growth and innovation by sharing risk between founders and investors, but it also means sharing control and future profits. While often the most transformative form of capital for scaling firms, it is also the most selective, tending to concentrate in high-growth sectors with proven potential.
Grant Capital consists of funds awarded to a business or organization that do not require repayment. Common examples include Small Business Innovation Research (SBIR) and Small Business Technology Transfer (STTR) grants, foundation awards, and state or federal development programs. Grants often target innovation, commercialization, or social impact, making them particularly valuable for early-stage firms that lack collateral or cash flow to secure traditional debt or for growth in targeted sectors.
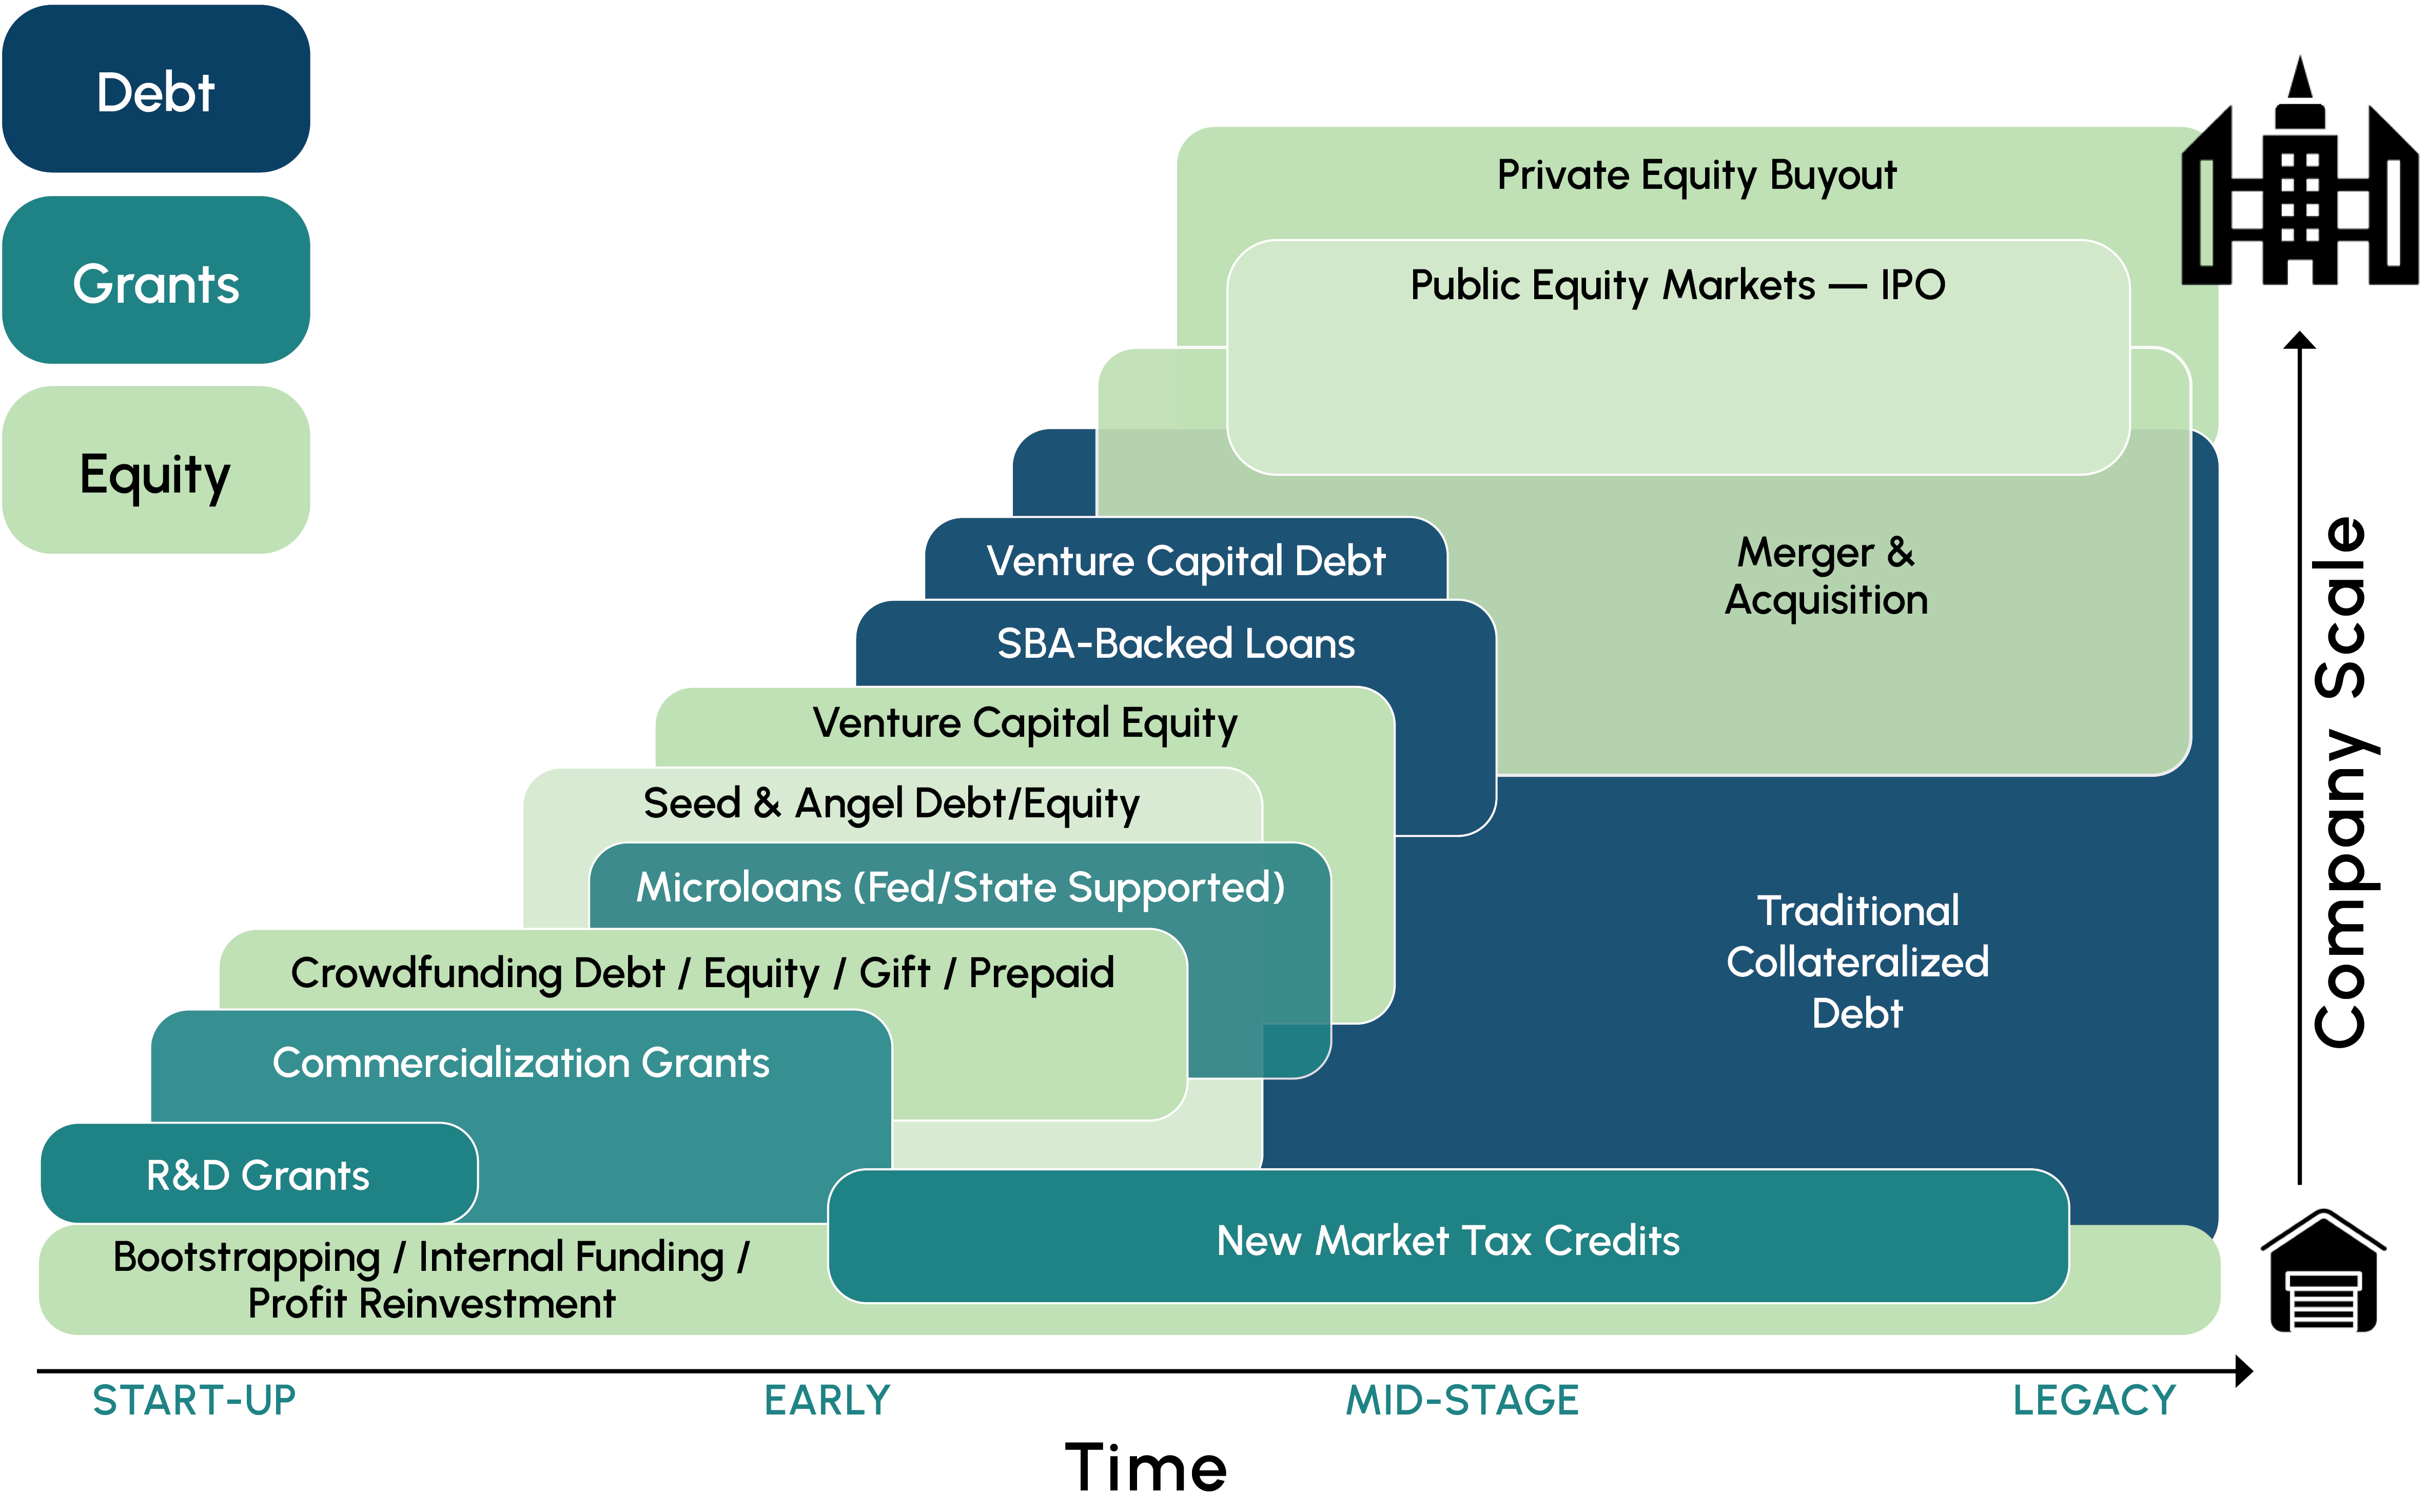
The Capital Ladder concept illustrates how different forms of capital align with the evolving needs of a business as it moves from concept to maturity. Earlier versions of the Oregon Capital Scan introduced this framework and this 2025 report includes an updated version of the Capital Ladder to more fully illustrate the capital landscape.
At the early stage, businesses rely primarily on internal and community-based resources—bootstrapping, crowdfunding, and early grant programs such as R&D or commercialization grants. These forms of capital are often small in scale but essential for testing ideas, validating markets, and demonstrating early traction.
During the mid-stage, firms begin to seek larger and more structured financing to scale operations. At this point, SBA-backed loans, microloans, venture capital, and angel equity become more prevalent. These sources help businesses move beyond proof of concept toward sustained growth, often blending debt and equity to meet different risk and cash flow needs.
By the late and mature stages, capital options expand significantly to include traditional collateralized debt, venture and private equity, public market offerings, and mergers or acquisitions. These forms of capital support expansion, acquisition, or succession, enabling firms to operate at larger scales and within more competitive markets.
Together, these layers of capital form a continuum, with each step on the ladder representing both the growth of a business and the increasing sophistication of the capital available to it.
While this Oregon Capital Scan offers a comprehensive look at capital flows, it is not intended to be an exhaustive encyclopedia of every financial program, institution, or policy in the state. The analysis does not attempt to evaluate the effectiveness of individual lenders or investment funds, nor does it make judgments about the merits of particular businesses or sectors. This report also does not provide prescriptive policy recommendations; its purpose is to illuminate patterns, gaps, and opportunities so that practitioners and decision-makers can chart their own strategies.
Similar to previous editions, this version of the capital scan focuses on capital availability, as opposed to capital accessibility. Capital availability is defined as capital that is made available for businesses to use. Capital accessibility is defined as the ability for business to access the available capital with ease. For example, a grant program that provides non-dilutive capital for commercialization for early stage businesses is an example of capital availability. Yet if the eligible small businesses are unaware of the grant, or face burdensome application requirements, that capital, while technically available, is effectively inaccessible.
Although this report centers on availability, accessibility is an essential part of understanding capital flows. Many people and businesses continue to face systemic barriers to financing rooted in a long history of overt and covert discrimination. These legacies persist today. Entrepreneurs who can leverage personal assets, such as home equity, as collateral for early-stage loans often have a decisive advantage, while those without such assets face greater risk or exclusion.
Data collection and analysis for this year’s Oregon Capital Scan is based in a data equity framework and focused on the guiding principles of reliability and relevance.
The data equity framework acknowledges that data analysis always requires a series of choices on the part of the researcher regarding what to include and how to represent data. It is also an affirmation of the fact that different data may over- or under-represent actors, communities and voices, and that the careless analysis of data may lead to misrepresentation of facts. The three core tenets of the data equity framework are: intentionality, transparency, and alignment. Intentionality means being aware of the choices we make regarding what data to use, and how it is included or analyzed. Transparency means documenting the choices we’ve made and being clear about data limitations including the possible under- or over-representation of different viewpoints and experiences. Finally, alignment means ensuring that the choices made are aligned with the research question and carefully consider the framing, takeaways and implications of data representation.
This analysis began with a review of datasets from previous Oregon Capital Scan reports, comparable literature, and other state and national studies. Additional research identifies new and publicly available datasets that can improve or update the understanding of Oregon’s capital landscape. The review of potential data included upwards of 50 unique data sources, far too many to analyze in depth. Using the guiding principles of reliability and relevance, each dataset was evaluated for its value to this and future reports, resulting in a narrowed list of about 20 core data sources analyzed throughout this report.
Data reliability boils down to a simple question: “Can this data provide trusted findings?” This assessment depends on the methods and completeness of data collection. Sampling methods, for example, can introduce bias if they are not random or representative of the full population. These datasets can still yield valuable insights, but require careful interpretation. For datasets that aim to represent a full population, reliability depends on how complete and comprehensive the coverage is. Some sources, such as federally mandated SBA small business loan datasets, offer relatively comprehensive data. However, those same data should not be generalized to all business lending, as they represent only a specific subset of financial activity.
Data relevance focuses on whether the data meaningfully reflects the current capital conditions. For example, older datasets, published many years ago, may be reliable, but may not provide relevant insights into capital conditions today. Some of the datasets used in previous Oregon Capital Scan reports focused on policies and capital sources created in response to the COVID-19 pandemic and are no longer relevant to current capital conditions.
After identifying the most reliable and relevant datasets available, a mixed-methods approach was applied. Quantitative analysis established capital-related patterns and insights within each dataset. Next, approximately 20 experts across the capital ecosystem (representing a range of industry clusters, institutions, and perspectives) were interviewed to provide context from lived experience. The final step of the analysis re-examined the data to determine how the qualitative findings confirmed, contradicted, expanded, or complicated that capital story.
A clearly defined research framework and conceptual model helped guide this analysis of capital across the state. Even as meaningful insights emerged, key limitations in the available data became apparent as well.
The first limitation is a misalignment between desired analysis and what is actually observable. Keeping in line with past Capital Scans, this analysis focuses on capital supply. However, the data underlying this report necessarily reflect only those instances where supply meets demand. The fulfillment of a financial transaction indicates an agreement of terms between a party interested in procuring capital and a second party willing to provide capital based on the costs and benefits evaluated by both parties. In this sense, interpreting capital flows can be challenging without the full picture of the supply and demand dynamics in industries. It is difficult to say with certainty whether a $100 million investment into an industry is meeting the demand for capital in that industry or if there remains unmet demand. On the flip side, if fewer deals than anticipated are observed in a given industry, it is difficult to say with certainty whether this is because of a lack of ready investors (supply), a lack of ready companies (demand) or a lack of agreeable terms to finalize the deal (evaluation of risk, valuation, profitability etc).
The second limitation is data availability. The vast majority of financial transactions undertaken in the economy are between private parties such as banks, investors, companies and entrepreneurs. The details of these transactions are usually private and not published in publicly available datasets. The data used in this report is therefore heavily reliant on financial mechanisms that are either supported by public parties or that are required to report transaction details under law. This limitation is partially mitigated by incorporating private data sources, such as PitchBook, though these do not capture all private business transactions. As a result, only selected windows remain through which to peer into the world of capital flows and there is no certainty that the unobserved segments of the market mirror the observable patterns.
The third limitation is sample size. There are often only a handful to a few dozen observable transactions for any one capital source in a given year. These low counts present a challenge to interpret trends with a high degree of certainty. This is a tension that arises in attempting to bring a narrower focus on the dynamics of specific industry clusters within the state, resulting in smaller observation counts. Randomness in data is harder to control at these levels as it becomes unclear if trends in the data are a result of concrete changes in the capital systems or a result of randomness. For instance, if the number of Seed investment deals in an industry cluster “rises” from 10 to 15 in a year and falls to 6 in the following year, it is unclear if this is because of true dynamic shifts in the industry or a “random walk” in the data.
To address this last limitation, the presentation of results is intentionally cautious. Where low observation counts limit confidence, the report shows the available data but does not discuss trends. Where trends appear possible but uncertain, the report highlights the potential patterns and trends while clearly acknowledging the limited certainty behind them.
Primary datasets used in producing this year’s Oregon Capital Scan include:
The research team analyzed many additional capital datasets, but these other data sets were not featured prominently in the report due to lack of consistency, data reliability, or data relevance.